This is the first day of the challenge but I have been tinkering with D3 for few days now.
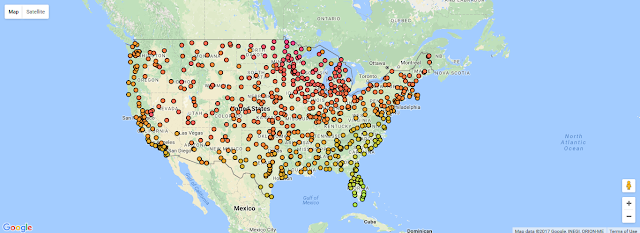
My first day started with an intention to project points on a map so, I had a look at few examples by they seemed complicated so I adjusted my aims from drawing the map with d3 to mapping the data with d3 and get the map from a map provider (google maps or leaflet). I started with an example by Mike Bostock which is very accessible and I adapted it. My data that I had which is the locations of temperature sensors spread across the US (source : GSOD) as well as summary temperature measurement for one day. I’m happy with the result for today as I managed to project the sensors on the map and color coded the points based on temperature measurement.
My adapted version of the code can be found on my github
Future directions : 1. Draw connections between nodes 2. include a slider to select the day of the year.