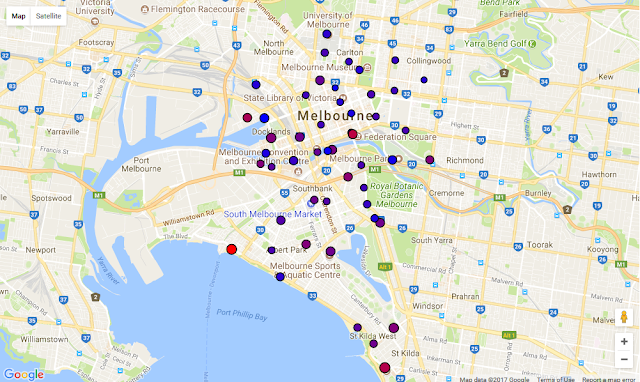
I started today with a goal to plot data from Melbourne city particularly Melbourne Bike Share stations on google maps with marker size and color representing the size of the station and the availability of bikes respectively in addition to tooltips containing the details of each station on hover.
Mapping the data went smoothly but tooltips turned to be tricky, it took me some time to decide to postpone it to another stage. I think the problem has to do with google maps handling events not D3 so in other words events are not being passed to D3. Handling events with google maps is straight forward but finding the current location of the markers to compare with the current mouse position is not clear at this point.
Anyway, I think the visualization is still interesting.