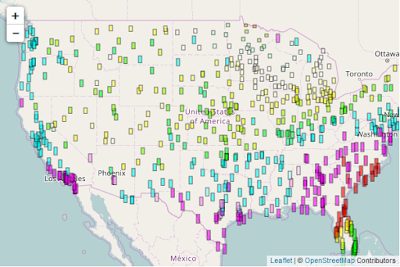
Today’s post is a bit delayed, anyway, I went through the same data from day 1 (temperature measurements) but this time I, used leaflet.js instead of google maps API starting from from the example. The beautiful thing about leaflet is that it doesn’t abstract the whole DOM event-handling like in google maps which means events set using d3 are handled normally.
I have manged to encoded the data in color, size and in text in the form of tool-tips.
The code can be found at here